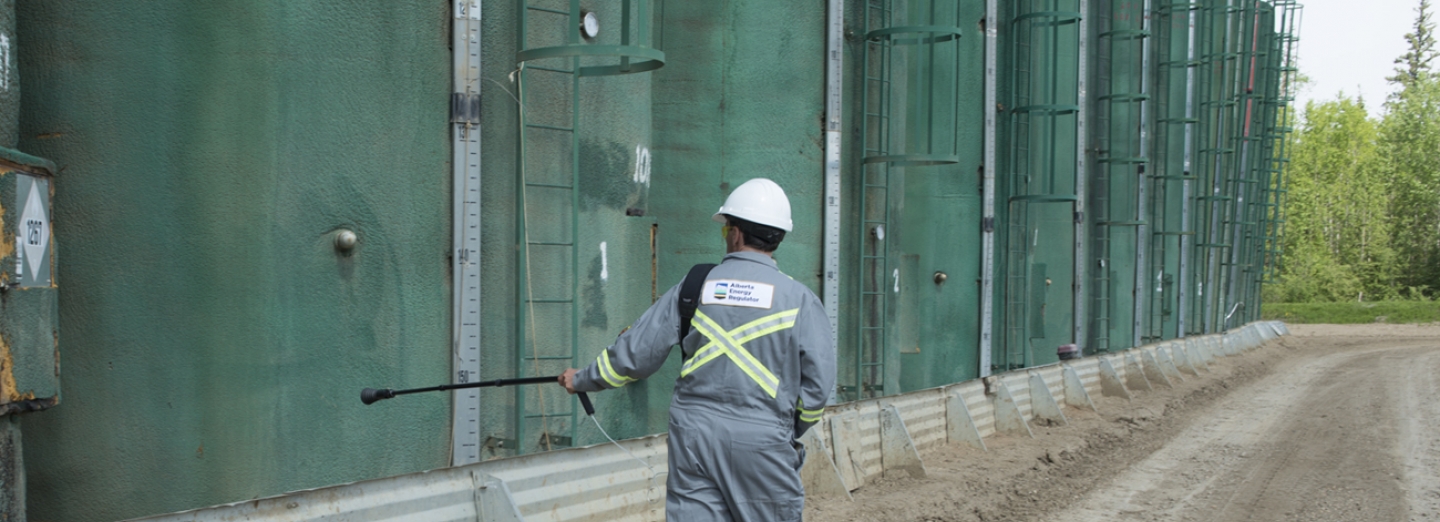
Our Peace River performance dashboard provides updates on our efforts to reduce flaring and venting and conserve gas in the Peace River area.
Progress Based on Outcomes and Performance
Updated quarterly, our progress on 6 outcomes and 12 key performance measures is based on the Report of Recommendations on Odours and Emissions in the Peace River Area. The 12 performance measures are described in our Summary of Peace River Outcomes document.
| Performance Measures | Region | 4th Quarter (Q4) 20191 |
Change from (Q3) 20192 | Target | Target Timeline | Additional Data | |
| Area | Operator | ||||||
| Reported volumes of gas vented from oil and bitumen batteries to Petrinex.4 Vented values are reported here in units of 1000 cubic metres (103 m3). | Peace River Area | No change | No change | 0.0 103 m3 reported venting of tank top and casing gas from heavy oil and bitumen operations | August 15, 2014 to September 30, 2018 |
Figure 1 | Figure 2 |
| Three Creeks | No change | No change | August 15, 2014 | Figure 3 | Figure 7 | ||
| Reno | No change | No change | August 15, 2014 | Figure 4 | Figure 8 | ||
| Seal Lake | No change | No change | September 30, 2018 | Figure 5 | Figure 9 | ||
| Walrus | No change | No change | October 1, 2015 | Figure 6 | Figure 10 | ||
|
|
|||||||
| Third Party audit/reporting of total leak volume on an annual survey. (Average leak volume (103m3) by site per area.) | Peace River Area (Three Creeks, Reno, Seal Lake and Walrus) |
Proposed reporting requirement in draft directive Requirements for Hydrocarbon Emission Controls and Gas Conservation in the Peace River Area (See appendix 4, "Annual FEMP Analysis Report") – may be included as a future performance measure |
|||||
|
|
|||||||
| Average monthly leaks by facility (operator and area basis) | Peace River Area (Three Creeks, Reno, Seal Lake and Walrus) |
Proposed reporting requirement in draft directive Requirements for Hydrocarbon Emission Controls and Gas Conservation in the Peace River Area (See appendix 2, "Monthly Leak Report Form") – may be included as a future performance measure |
|||||
|
|
| Performance Measures | Region | 4th Quarter (Q4) 20181 |
Change from Q4 (2017)2 | Target | Target Timeline | Additional Data |
| Area | Operator | |||||
| Percentage of nonroutine flaring by operator (per cent of total produced gas on site) | Peace River Area (Three Creeks, Reno, Seal Lake, and Walrus) | Directive 084, Effective April 1, 2017 introduces new limitations on nonroutine flaring. Starting March 1, 2019, a licensee’s nonroutine flaring volumes must not exceed 3.0 per cent of its total gas production volumes in any calendar year. Fuel gas used for pilots or flare system purge is excluded from this calculation. | ||||
| Performance Measures | Region | 4th Quarter (Q4) 20191 |
Change from (Q3) 20192 | Target | Target Timeline | Additional Data | ||||
| Area | Operator | |||||||||
|
Per cent of gas conserved in the Peace River area (based on Petrinex4 data) Gas Conservation Calculation:
|
Peace River Area | 98.04% | 0.14% | 95 per cent across the entire Peace River area (Three Creeks, Reno, Seal Lake, and Walrus) | September 30, 2018 | Figure 11 | ||||
| Three Creeks | 98.06% | -0.25% | September 30, 2018 | Figure 14 | Figure 13 | |||||
| Reno | 99.91% | -0.08% | December 31, 2017 | |||||||
| Seal Lake | 97.00% | 2.25% | September 30, 2018 | |||||||
| Walrus | 98.77% | -0.31% | September 30, 2018 | |||||||
NOTE: The AER is no longer performing proactive inspections as of March 2019 as there has been 100% proactive inspection compliance since September 2018.
| Odours and emissions complaints reported to the AER in the Peace River area | Figure 15 |
| Performance Measures | Region | Peace River area resident survey |
| Peace River area resident survey | Peace River Area | 2016 AER Peace River Survey |
Performance MeasuresRegion4th Quarter
(Q4) 20191Change from Previous MonthTargetTarget TimelineAdditional DataAreaOperator99th percentile7 of monthly one-hour measurements of total hydrocarbonThree Creeks 842 station2.09 ppm (Oct 2019)
2.09 ppm (Nov 2019)
2.18 ppm (Dec 2019)- 0.08 ppm
0.00 ppm
+ 0.09 ppm PRAMP8 to confirm2016Figure 16Three Creeks 986 station2.14 ppm (Oct 2019)
2.12 ppm (Nov 2019)
2.14 ppm (Dec 2019)- 0.06 ppm
- 0.02 ppm
+ 0.02 ppm2016Reno station2.23 ppm (Oct 2019)
2.21 ppm (Nov 2019)
2.35 ppm (Dec 2019)+ 0.04 ppm
- 0.02 ppm
+ 0.14 ppm2016
99th percentile of monthly one-hour measurements of nonmethane hydrocarbonThree Creeks 842 station
0.00 ppm (Oct 2019)
0.01 ppm (Nov 2019)
0.00 ppm (Dec 2019)
0.00 ppm
+ 0.01 ppm
- 0.01 ppmPRAMP8 to confirm2016Figure 17Three Creeks 986 station0.00 ppm (Oct 2019)
0.00 ppm (Nov 2019)
0.00 ppm (Dec 2019)0.00 ppm
0.00 ppm
0.00 ppm2016Reno station0.02 ppm (Oct 2019)
0.00 ppm (Nov 2019)
0.01 ppm (Dec 2019)+ 0.02 ppm
- 0.02 ppm
+ 0.01 ppm2016
99th percentile of monthly one-hour measurements of total reduced sulphurThree Creeks 842 station0.76 ppm (Oct 2019)
0.60 ppm (Nov 2019)
0.58 ppm (Dec 2019)+ 0.01 ppm
- 0.16 ppm
- 0.02 ppm PRAMP8 to confirm2016Figure 18Three Creeks 986 station3.80 ppm (Oct 2019)
0.86 ppm (Nov 2019)
0.68 ppm (Dec 2019)+ 1.14 ppm
- 2.94 ppm
- 0.53 ppm2016Reno station1.06 ppm (Oct 2019)
0.53 ppm (Nov 2019)
0.70 ppm (Dec 2019)- 1.59 ppm
- 0.53ppm
+ 0.17 ppm2016
Notes
| 1 | Quarter refers to calendar quarter. There will be four quarters in a calendar year: Q1 (January, February, March), Q2 (April, May, June), Q3 (July, August, September), and Q4 (October, November, December). |
| 2 | Per cent difference. The actual change in value is also shown in brackets where appropriate. |
| 3 | Peace River area: This refers to the Three Creeks, Reno, Seal Lake, and Walrus areas as identified in the Peace River Proceeding |
| 4 | Data queried from Petrinex in March, 2019 |
| 5 | Flare data obtained from Petrinex includes both routine and nonroutine flaring volumes. Gas conservation rate requirements proposed for the Peace River area may allow for nonroutine flaring volumes to be excluded from the gas conservation calculation. |
| 6 | Odour events are tracked through the odour complaints that the AER receives and through AER inspections. |
| 7 | The data presented is the 99th percentile of the hourly measurements gathered in any given month. Only one per cent of the hourly measurements in any given month would be higher than these values. |
| 8 | Peace River Area Monitoring Program |
Disclaimer: This information is for general information purposes. The AER makes no representations, warranties, or guarantees, expressed or implied, as to the accuracy, reliability, or currency of this information, and the information may not be suitable for all [or some] uses. The AER accepts no responsibility whatsoever for any errors or omissions in the information or for any losses or costs that anyone incurs as a result of using, converting, publishing, transmitting, installing, or improving it, even if such losses or costs were foreseeable. Anyone intending to rely on this information is advised to confirm both its accuracy and currency.


