
Updated June 2019
No two pipelines are the same. With how diverse the types of pipelines, products, methods of operating, and needs of each company are, each pipeline must be closely monitored. We oversee and work alongside companies to help prevent pipeline incidents, hold pipeline companies accountable for their actions, and expect them to do their part to ensure that their pipelines are safe.
Each year, we release the Pipeline Performance Report as part of our industry performance program, which measures, evaluates, and reports on the energy development activities that we regulate. The report includes information about each company involved in a pipeline incident—even if the pipeline was hit but did not leak. Also included is data on all AER-regulated pipelines and on each pipeline failure between 2015 and 2018. This analysis includes the volumes and substances that were released, as well as the different causes of these incidents.
Highlights
The total number of incidents in 2018 was 32 per cent lower than in 2009—even with the growth in the total length of pipelines by 15 per cent over the same period. The pipeline failure rate was at 0.96 incidents per 1000 kilometres of pipeline per year in 2018 compared with 1.62 in 2009. The rate dropped largely because of improved requirements and inspection procedures and a greater focus on industry education about pipeline safety.
Highlights from 2018 also include:
- The number of pipeline incidents in Alberta remained consistent at 416 incidents compared with 415 incidents in 2017.
- About 86 per cent of incidents were rated as being low consequence in terms of their effect on the public, land, environment, wildlife, and livestock, while 8 per cent were rated as medium consequence, and 6 per cent were high consequence. Learn more on incident consequence ratings in the glossary.
- The number of pipeline incidents that were rated as high consequence dropped by 8 per cent, decreasing to 24 incidents in 2018 from 26 incidents in 2017.
- Ninety-two per cent of incidents rated as high consequence involved pipelines carrying salt water, or oil-well effluent, which is a mixture of oil, gas, and salt water.
- Salt water pipelines had an overall pipeline incident rate of 2.6 incidents per 1000 kilometres per year, while oil‑well effluent pipelines had a failure rate of 2.3 incidents per 1000 kilometres per year.
- Internal corrosion remained the leading cause of pipeline incidents at 38 per cent of all pipeline incidents. More than 80 per cent of internal corrosion failures were on steel uncoated pipelines (up from 77 per cent in 2017), with the majority remaining being failures on the metallic risers or connections on nonmetallic pipelines.
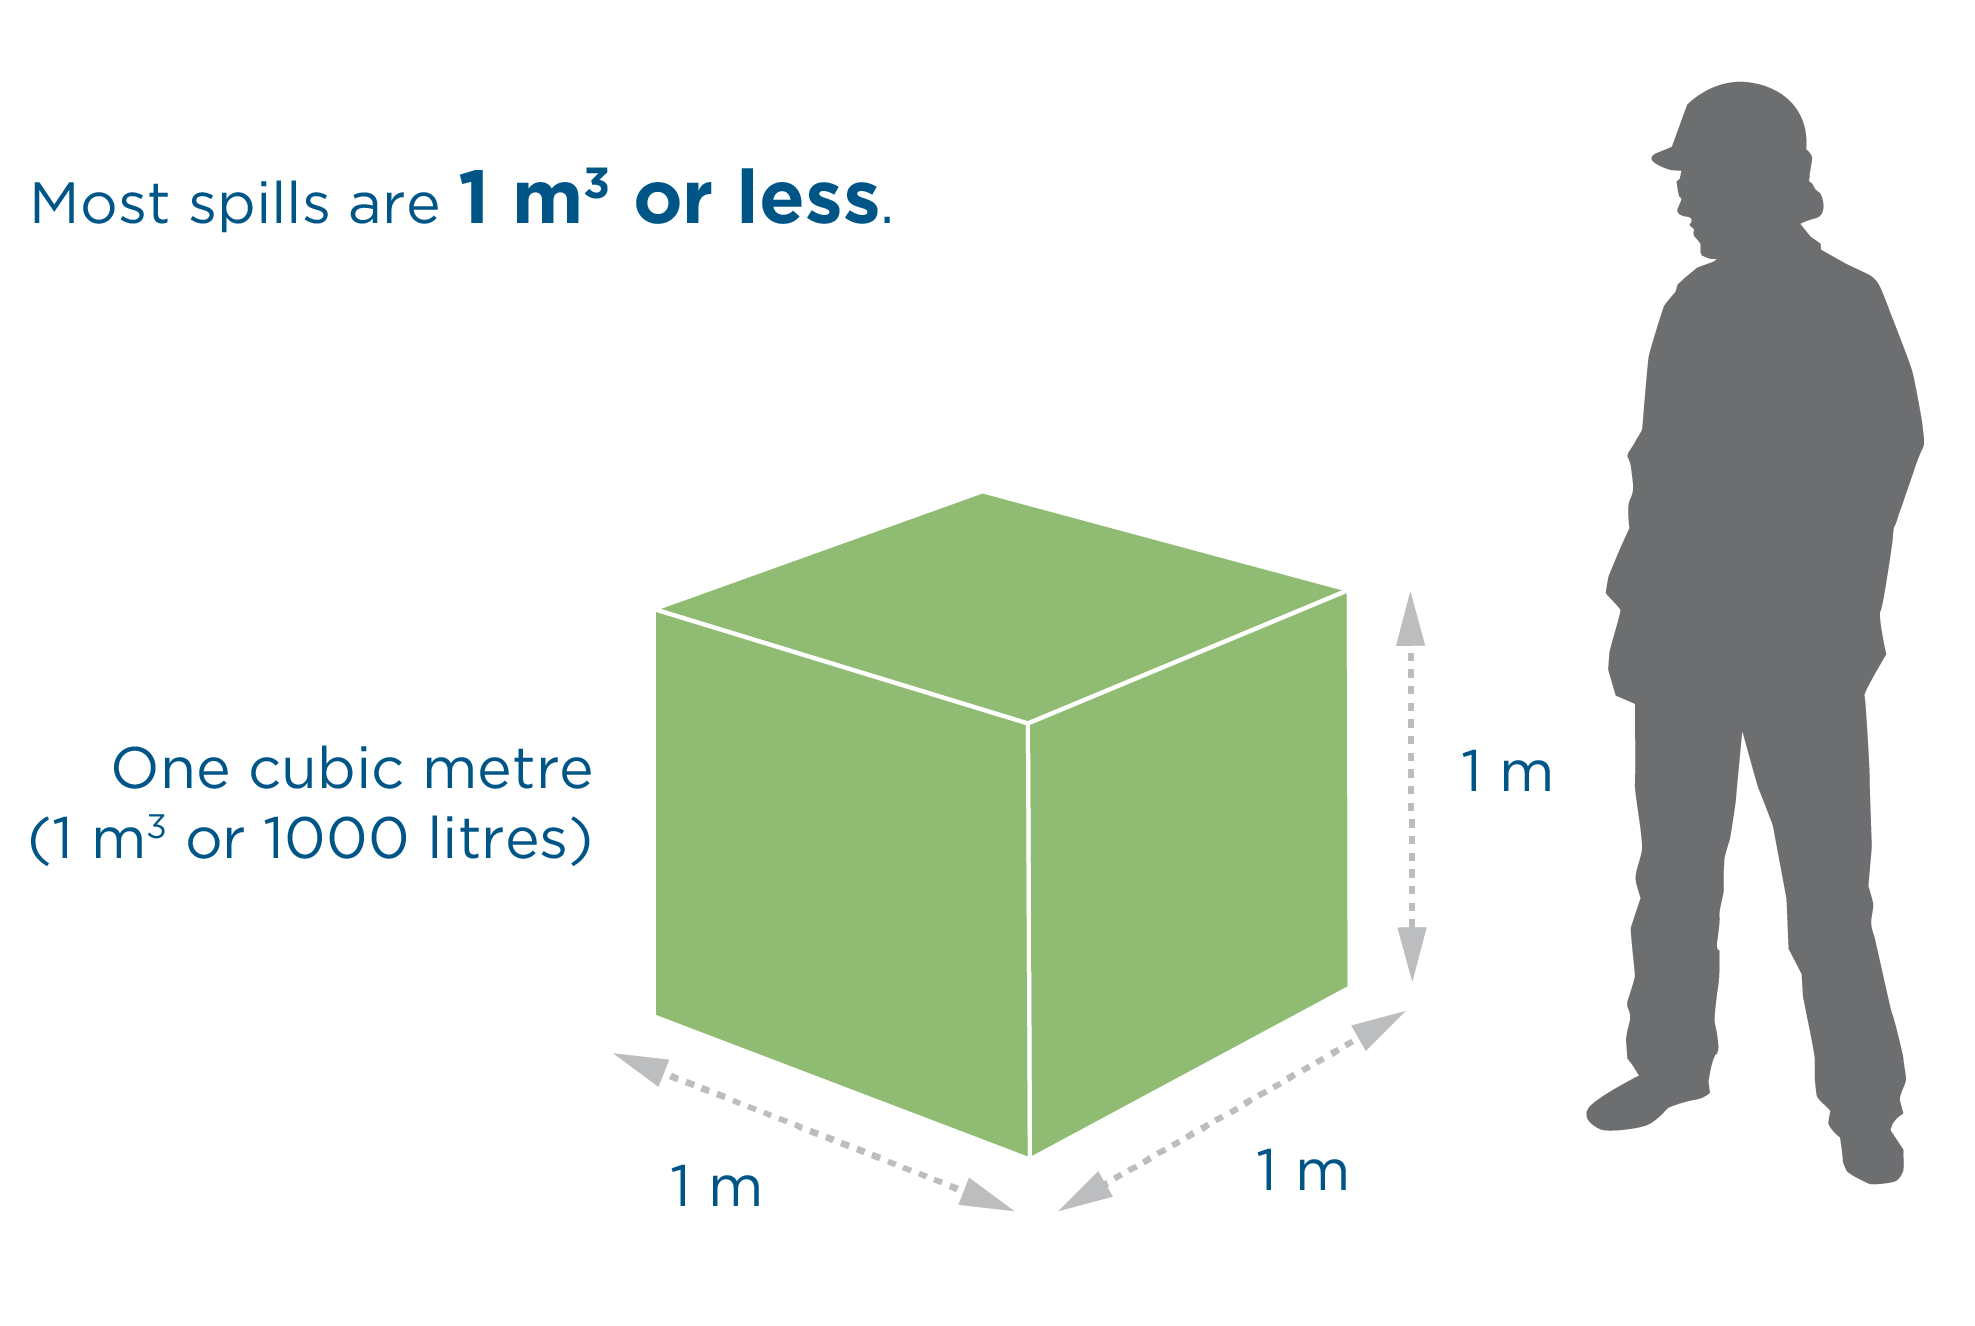
- Over two-thirds (67 per cent) of pipeline incidents had little (less than or equal to 1 cubic metre or about 6 barrels) to no liquids released. In 2018, the largest liquid spill released was 335 m3 of salt water.